The short version: use flamegraphs for aggregation, not chronology
A timeline is best when you need to know what happened at a particular instant. A semantic flamegraph is better when the question is “where did the model budget accumulate across these sessions?” or “which task families touched the most files?” agentpprof merges operations with the same semantic stack, so repeated behavior becomes wider instead of remaining thousands of isolated events.
The stack is a projection over agent activity rather than a literal call stack. The current tool reads agent-native history through AgentSight's agent-session layer and does not load eBPF probes or require root. That makes it useful for already-recorded local history, but it also means a flamegraph does not independently prove every process, filesystem, network, or resource effect that happened on the host.
Start with a frozen input set if the result must be reproducible
By default, agentpprof --project-root scans recent local Codex and Claude Code sessions that match the project. That is convenient for exploration, but the source set changes as new sessions appear. A publishable comparison should name the project revision and pass explicit --session-file inputs so another reviewer can profile the same records later.
$ agentpprof --project-root /work/repo --session-file ~/.codex/sessions/.../session.jsonl --session-file ~/.claude/projects/.../session.jsonl --view tokens -o tokens.svg
$ agentpprof --project-root /work/repo --session-file ~/.codex/sessions/.../session.jsonl --view time -o time.svg
Record the AgentSight version, session files or stable identifiers, project revision, selected view, tag rules, operation mappings, filters, stack definition, and output format. If any of those change, two charts with the same title can represent different measurements.
Current agentpprof support is narrower than the shared session parser
AgentSight's reusable session layer can normalize several native agent formats, but agentpprof v1.0.31 specifically documents direct local-history input from Codex and Claude Code JSONL. Do not infer flamegraph support for every provider merely because another AgentSight view can discover that provider's sessions. Treat the agentpprof README and CLI as the compatibility boundary for this guide.
This distinction matters when comparing agents. A missing provider in a flamegraph is not evidence that the provider used zero tokens or produced no effects; it can simply be outside the profiler's current input path.
Five views share a stack model but use different units
Width has no universal meaning. Pick the view before looking for a hotspot, and never compare bar widths from two different views as if they were the same quantity.
| View | Width means | Question it answers | Important caveat |
|---|---|---|---|
operations | One count per prompt, tool, or LLM operation | Which semantic paths occur most often? | Frequency is not cost or importance. |
tokens | Reported token count, otherwise a bounded text estimate | Where did model budget accumulate? | It is a profile weight, not reconciled billing. |
time | Seconds between successive timestamped events | Which activities occupy wall-clock intervals? | It is not sampled CPU time. |
files | File/path effect count | Which semantic paths touch the most paths? | A count is not a security verdict. |
network | Network/domain effect count | Which tasks are associated with destinations? | Frequency is not payload volume. |
The default stack is a semantic field projection
Current agentpprof operations are field bags. The default stack is task → skill → phase → action → object → repeat → result → outcome, with an additional token frame in the tokens view. project, agent, and session remain pprof sample labels rather than default frames, so go tool pprof -tags can group them without making every visual stack deeper.
--op-map or --op-map-file derives or rewrites operation fields, --where filters after mapping, and --stack plus --stack-rule selects the hierarchy shown in the output. Those transformations are part of the measurement method because they control which operations merge.
$ agentpprof --project-root . --op-map 'task:verify=(?i)cmd=cargo|effect=test' --where 'task=verify' --stack task,action,result,object --view operations -o verify.foldedTagging quality is part of the measurement, not decoration
Raw prompts are poor frame names: they are long, multilingual, non-deterministic, and often sensitive. The deterministic workflow uses ordered regex rules; an LLM tagger and an experimental clustering backend can help discover categories, but a reproducible chart should retain the final rules or tag cache that produced its labels.
The current v1.0.31 flamegraph skill treats all three unmatched categories — prompts, sessions, and LLM calls — as coverage gates below 5%. Its distribution heuristics aim for roughly 10–20 categories, top-1 share below 40%, top-3 share below 70%, and normalized entropy above 0.7. These are diagnostics for coarse or incomplete taxonomies, not statistical confidence intervals. Never satisfy the thresholds with a catch-all misc rule; that only hides missing classification work.
$ agentpprof --project-root . --tagger regex --tag-rule 'prompt:review=(?i)review|diff|regression' --tag-rule 'prompt:debug=(?i)fix|bug|error|broken' --view tokens -o tagged.json --format jsonAgent Flamegraph and report token answer different token questions
The most important v1.0.31 interpretation boundary is that agentpprof --view tokens and agentsight report token are not interchangeable accounting commands. A flamegraph assigns token weight to semantic stacks from the selected native Codex/Claude sessions. report token summarizes an AgentSight materialized view: an explicit --db selects a saved database; without one, the report command first uses the latest agentsight-*.db when available and only then falls back to recent native sessions. agentsight report --local token forces the native-session path.
| Question | agentpprof --view tokens | agentsight report token |
|---|---|---|
| Primary job | Aggregate token weight under semantic task/action stacks. | Reconcile and summarize effective token rows by model, provider, process, PID, or working directory. |
| Input boundary | Local Codex/Claude Code session files selected by project or explicit file. | Explicit or latest saved AgentSight DB by default; recent agent-native sessions when no DB exists or --local is requested. |
| Missing token counts | Can use bounded text estimates; unsafe huge estimates become unknown=1. | Uses recorded token rows and source-specific reconciliation; it does not turn absent usage into a text estimate. |
| Duplicate/source handling | Profile semantics follow the selected native session records. | Chooses effective rows by call/source priority and has special aggregate reconciliation for Gemini stdout totals. |
In the current materialized view, response-observed usage has higher priority than orphan response usage, Gemini CLI stdout statistics, Claude telemetry, and agent-native rows for the same effective call key. Gemini aggregate stdout rows also have a separate comparison against captured network totals. That reconciliation is useful for source accounting, but it is not what gives a semantic flamegraph its category widths.
$ agentsight report token --db run.db --group-by model
$ agentsight report --local token --group-by dir --json
$ agentpprof --project-root . --session-file ~/.codex/sessions/.../session.jsonl --view tokens -o tokens.svg
Therefore, a difference between the two totals is not automatically a bug. First compare the exact session set, whether a saved DB was used, whether network/telemetry/native rows were reconciled, and whether agentpprof had to estimate any missing token counts. Use report token when the question is source accounting; use agentpprof when the question is semantic distribution. Neither command converts token counts into provider invoice cost by itself.
Token width has a deliberate failure mode
Flamegraph token profiles prefer counts reported by the source agent. When those are unavailable, the current implementation can use bounded text estimates. Very large unsafe estimates are recorded as unknown=1 rather than allowed to dominate the profile. A wide token bar should therefore be traceable to a reported or bounded source, not silently interpreted as an exact provider bill.
For cost analysis, also separate input, output, and cache-related token kinds when the source exposes them. Provider prices, cache discounts, subscription allowances, and model-specific billing rules belong in a separate dated calculation.
Output format changes what can leak
pprof protobuf and folded stacks are useful for tooling; SVG is a self-contained visual artifact; JSON adds redacted session summaries and the stack table. Current agentpprof groups paths outside the selected project root into stable external/* buckets so home-directory names do not have to appear in public profiles. JSON previews are different: --include-previews can include prompt, command, and LLM-output snippets and should only be used on already-sanitized sessions.
$ agentpprof --project-root . --view tokens -o tokens.pb.gz
$ agentpprof --project-root . --view time -o time.folded
$ agentpprof --project-root . --view files -o files.svg
$ agentpprof --project-root . --view network -o network.json
A first-party example shows the format, not your workload
The AgentSight repository ships token, time, file, network, benchmark, and OSWorld-Human examples. The token image below is pinned to the same v1.0.31 product commit used by this guide. It demonstrates prefix merging and width allocation; it is not a benchmark or a claim about another team's sessions.
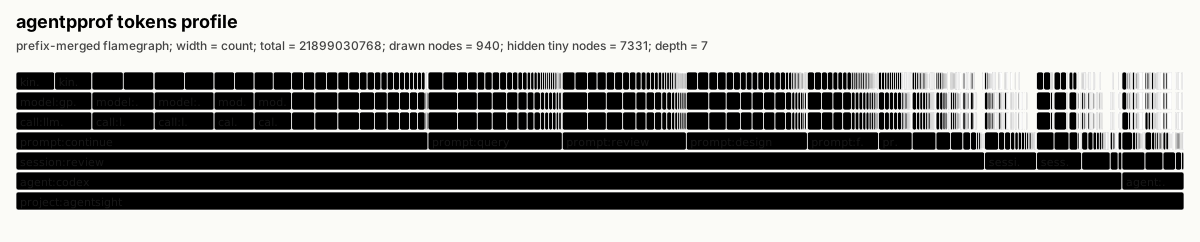
For a real investigation, regenerate the chart from the bounded session set you care about. If the conclusion changes when you switch from tokens to time, that is useful information: model budget and elapsed time are concentrated in different parts of the workflow.
Aggregate first, then return to the original session
Aggregation deliberately removes chronology. A wide review or debug category tells you where to look, but it does not tell you which command failed or why an agent repeated a step. After identifying a hotspot, filter to the relevant project, agent, session, or semantic field and inspect the original trace, AgentSight report, or timeline for the causal sequence.
This two-stage workflow is the useful complement to a long span list: aggregate to find dominant categories, then drill into source records only where the profile says budget or effects are concentrated.
A reproducible publication needs the method, not only the SVG
A reviewer should be able to answer: which sessions were included, which AgentSight commit parsed them, which view and unit set width, which tag rules were used, whether operation fields were rewritten, which filters and stack frames were selected, whether previews were enabled, and which project revision the sessions refer to. Save that method next to the image or report.
If you compare two periods or agents, keep the taxonomy and stack definition fixed unless the experiment is explicitly about changing them. Otherwise a visual difference can come from the classification method rather than agent behavior.
Primary and first-party sources
- agentpprof v1.0.31 README: inputs, views, formats, privacy, and selectors
- AgentSight v1.0.31 semantic flamegraph guide and examples
- AgentSight v1.0.31 iterative tagging workflow and quality gates
- AgentSight v1.0.31 report token CLI contract and fallback selection
- AgentSight v1.0.31 materialized-view and native-session loading
- AgentSight v1.0.31 effective-token reconciliation and grouping
- AgentSight v1.0.31 first-party flamegraph example gallery